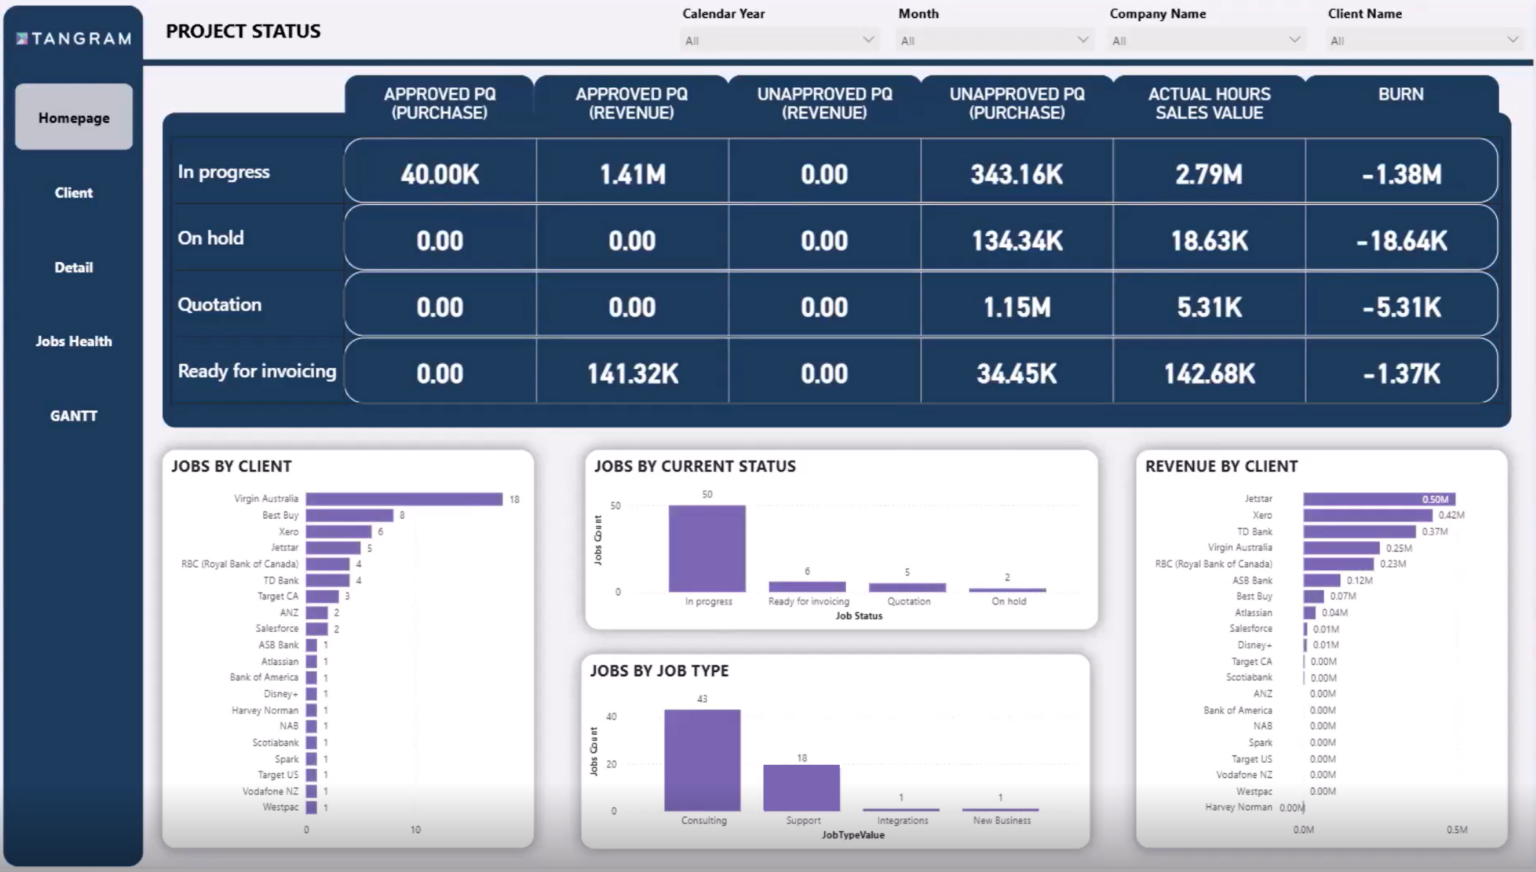
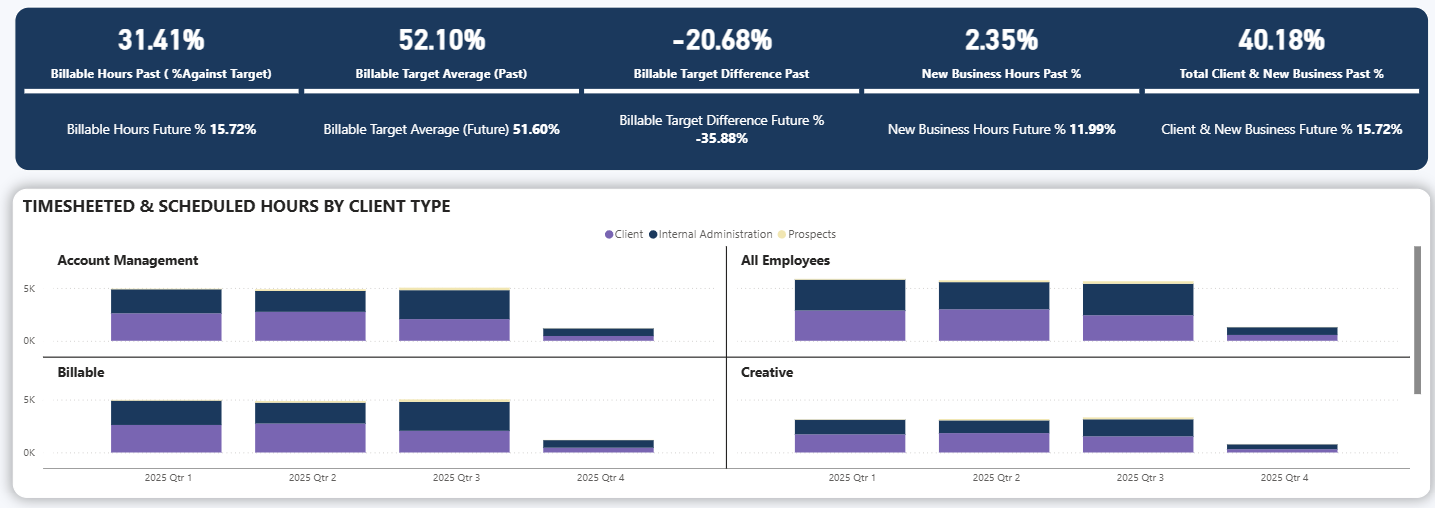
Agencies often spend hours every month pulling reports, reconciling spreadsheets, and trying to understand whether they’re on track. The Budget & Finance Dashboard brings all that information together in one clear view, giving you real-time visibility of budgets, actuals and forecasts straight from WorkBook.
It shows where you’re performing well, where costs are creeping up, and how your margins are tracking so you can make informed financial decisions faster.
https://tangram.s.cttn.co.uk/wp-content/uploads/2025/10/PBI-Budget-Finance-Website-version.mp4
What is the Budget & Finance Dashboard?
The Budget & Finance Dashboard connects directly to your WorkBook data to bring budgets, actuals and forecasts into one place. You can see performance across revenue, cost and margin at a company, client or project level, all updated automatically.
Put simply, the dashboard gives you the financial clarity to manage the business proactively, not reactively.
Key features:
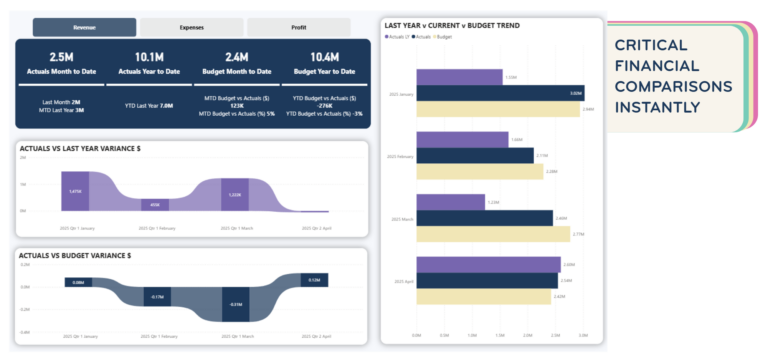
- Compare actuals against budgets and forecasts
- Analyse revenue, cost and margin trends over time
- Drill from high-level company results to client or project detail
- Filter by company, client, date or department
- Spot over or underspend early and take corrective action

Why It’s Helpful for Agencies
Understanding financial performance shouldn’t be difficult. The dashboard makes it easy to see exactly where your money is going and what’s driving your results.
It gives finance and leadership teams the insight they need to plan ahead, not look back.
It helps you:
- Track whether you’re on budget at any point in time
- Identify cost areas impacting profit
- Strengthen forecasting accuracy with live data
- Replace static spreadsheets with interactive reports
- Give everyone a single version of financial truth
With everything connected, agencies can move from chasing numbers at month end to managing performance in real time.
How agencies use it
Finance and leadership teams use the Budget & Finance Dashboard for monthly reviews, forecasting and day-to-day visibility. It’s also a valuable tool for department heads who need to track performance across clients or service areas.
Typical uses include:
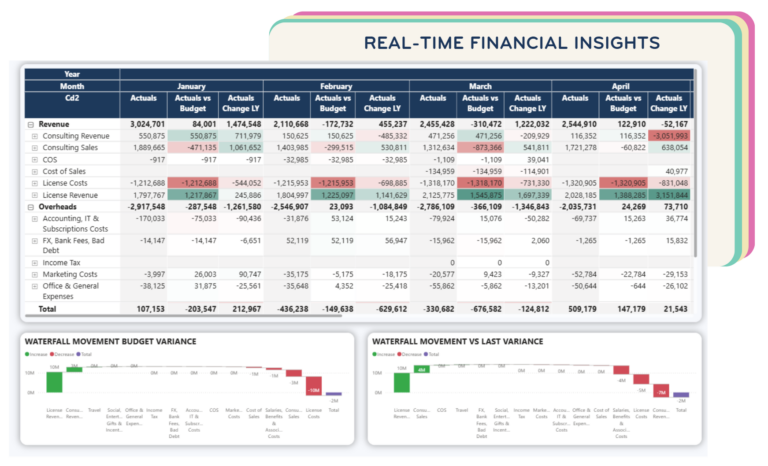
- Reviewing budgets versus actuals each month
- Identifying overspend or underperformance early
- Comparing trends across clients, projects or teams
- Supporting reforecasting discussions and planning cycles
Many agencies use it alongside the Client Profitability and Time Tracking & Productivity dashboards for a complete view of performance, from effort and cost through to margin and profit.
Explore Our BI & Dashboard Webinars
Discover how to turn data into clarity with our expert‑led webinar sessions covering team productivity, client profitability and practical databoards in Power BI.