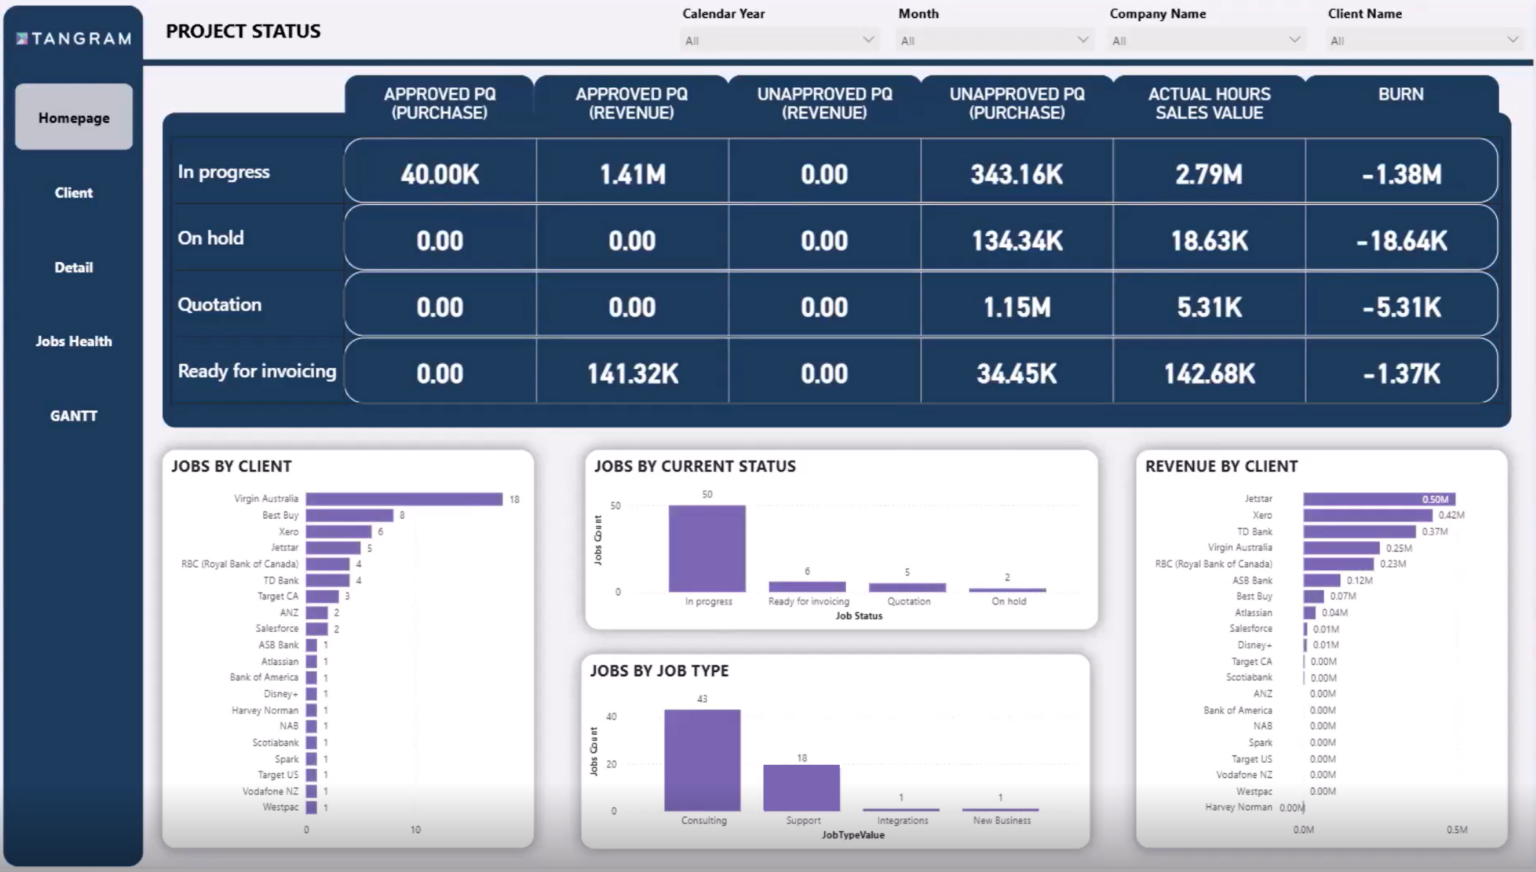
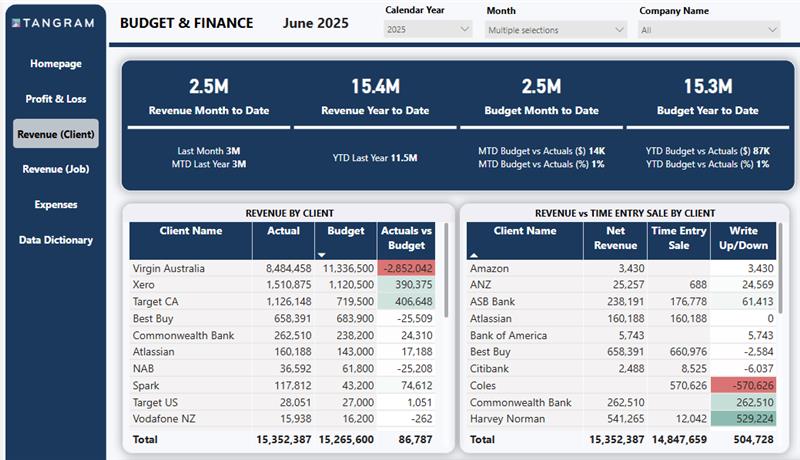
Whether you’re running a global agency or building a small but mighty team, time is always in short supply and often the most expensive thing you’re paying for. That’s why we built the Time Tracking & Productivity Dashboard as part of Tangram’s Core Power BI package. It gives agencies a clear way to see how their teams are scheduled, what’s actually being booked, and where the gaps are before they become an issue.
Here’s a look at what it is, how it’s helping agencies, and how easy it is to get started.
https://tangram.s.cttn.co.uk/wp-content/uploads/2025/07/PBI-Time-Tracking-Edit-2-1.mp4
What is the Time Tracking & Productivity Dashboard?
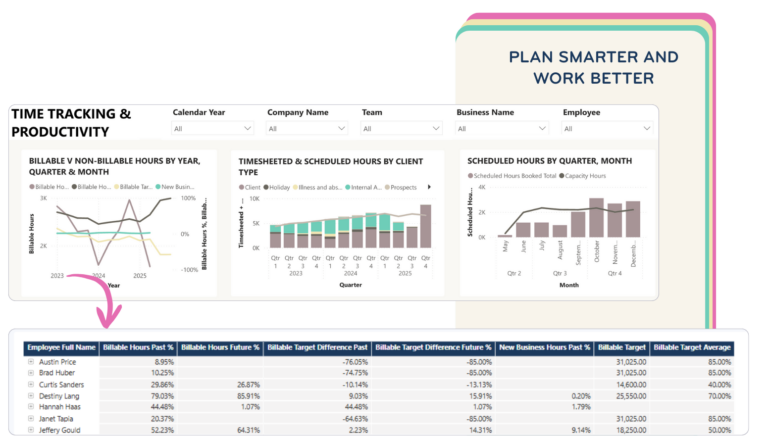
This is a ready-to-use Power BI dashboard that connects directly to Deltek Workbook. It focuses on what’s ahead, not just what’s already happened, giving you a forward-looking view of workload, team capacity, and how scheduled hours stack up against time actually worked.
Key features of the Time Tracking & Productivity Dashboard include:
- Headline metrics like scheduled hours, booked hours, utilisation percentage and upcoming availability
- Side-by-side comparisons of scheduled and booked hours by team, employee or office
- Capacity forecasts that highlight future resourcing gaps or bottlenecks
- Detailed breakdowns of scheduled time across projects, teams and service areas
- A forward schedule table showing who’s booked, when, and for how long

Why It’s Helpful for Agencies
Agencies are often juggling resourcing, delivery and team wellbeing. Without a clear view of what’s coming, planning becomes reactive. This dashboard helps teams take control with insights that support early decision-making and better day-to-day management.
It helps you:
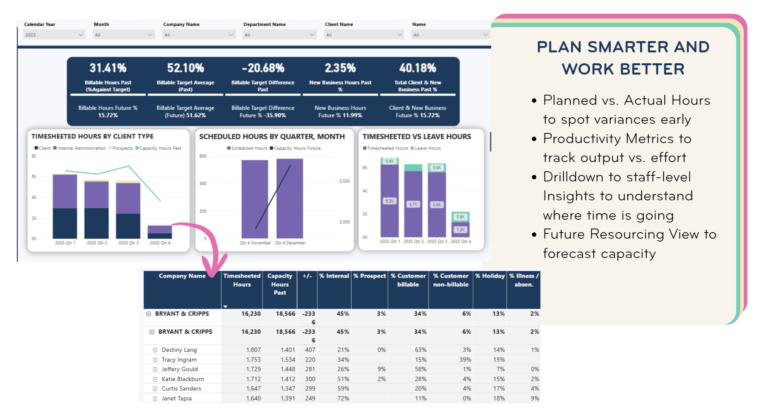
- Understand how your team is scheduled over the coming weeks
- Identify under- or over-utilisation early
- Balance workloads across the team before burnout or bottlenecks occur
- Share one source of truth for standups, planning and resourcing conversations
- Replace manual reports with a live view of capacity
Explore Our BI & Dashboard Webinars
Discover how to turn data into clarity with our expert‑led webinar sessions covering team productivity, client profitability and practical databoards in Power BI.
- WTF is all the hype about databoards and Power BI?
- WTF are my team doing and how profitable are they?
- WTF are unprofitable clients doing to your bottom line?